Mortal Online “Play as a ghost” Patch
![]()
Spiritism Patch Notes 1.84.00.14
Added:
- Added support for hiding objects in the ether world in the Unreal Engine core. This should make what you see in the ether worlds and not much more consistent.
- Added support for items that can be picked up in the ether world.
- Added support for items that drop outside of the loot bag.
- Added support for pickables that only show in the ether worlds or only outside of the ether worlds.
- Added support for spell books.
- Add skill Scribing.
- Added Scribing book.
- Added different rare unique collector spell books to Ai drops.
- Added different size spirit boxes to Ai drops.
- Added bunches of icons and fixed some existing ones.
- There’s now an option in the options menu that lets you turn on a warning when you are hitting a blue player while being blue. This warning will stop the outgoing damage in a attempt to battle “blue blocking”.
- You will now exit combat mode when hitting a blue player while having the option to damage blue players off.
- You can now attack with left mouse button in the ether world.
- Built custom collision solution when tracing while dead.
- Added one extra row of icons to loot and chests UI.
- Added core support for collision in alternative dimensions.
- New calculation for value of spirit boxes.
- Choosing Acolyte after finishing the tutorial will now give you a basic spell book.
- Added a ground guard slot to Watchtowers.
- Added a guard slot to TC starting location.
- Added a small cave for new players in Tindrem garden.
- Added correct values to Flat and Recurve shapes in bow crafting.
- Added a new system for bows that has a required strength that’s higher than the users strength.
- These bows will now use a dynamic draw time and stamina penalty system based on the strength difference between bow and user.
- Added a new attack to Ratzar Queen.
- It is now possible to sell stacks that were split while then vendor window is open.
- Added “Drop loot” button to paper doll window.
- Added Inscription.
- Added CanAttackBlue in options.
- Added custom tool tip info for spirit boxes.
- Tool tips for items when selling to vendors will now show value of whole stack, not value of single item in stack.
- Messages in chat when pet deals or takes damage.
- Added quantity of reagents in spell book.
- Built a new class to handle the ether world.
- You can now add un-sealed scrolls to spell books.
- Added “lock hotbars” option.
- Better formatting for spell book tool tip.
Changes:
- Last spell and last spell self will no longer trigger if you are in mouse mode, making it possible to have mouse1 and 2 set to these commands.
- None stacking buffs will no longer refresh timers.
- Using a bandage will while corrupted will now work but not give any HP until corrupt runs out.
- You now need to have a spell book in your inventory to cast spells.
- Destroying guild stones in houses will no longer destroy guilds, instead it will defeat them canceling all wars and clearing all guild stones.
- Blacklist trigger timer down from 30 to 20 sec.
- Items taken out of a blue loot will now be flagged as stolen.
- You can no longer cast spells in mercy mode.
- AI will no longer attack targets in houses.
- Tweaked calculation on knockdown from AI
- Tool tips for items when selling to vendors will now show value of whole stack, not value of single item in stack!
- No longer possible to interact with inventory when dead.
- All windows now closed when transitioning from dead to alive.
- AI with knockdown will now knockdown from mounts.
- Reduced knockdown velocity when thrown of from a mount.
- Updated effects for transcendental awareness
- Manifest mechanic has been removed
- Help Chat now lasts 10080 minutes (1 week)
- Rioting NPCs will no longer try to attack dead players.
- Fire arrows now does 25% more elemental damage.
- Dead players now get teleported out of locked houses.
- Alert towers now report unbuilt siege weapons.
- Battering Ram now correctly flag when hitting something.
- Increased carcass drop on Clothos Maiden Queen.
- Tweaked Kimuru movement attacks.
- Changed sell value on Windfish meat that was to low.
- Siege weapons now more correctly find the ground if fired from very high ground.
- Light shafts when dead are now red and get removed if they are way to far away from you. This could possibly solve the issues some AMD users have with FPS when dead.
- Mindblast now causes head explosions.
- Tweaked Scythes head tracing for better hit detection.
- Increased drop in Elemental Priest.
- Elite mages no longer cast fire spit.
- Mage NPC’s now only prefers ranged attacks rather then going unarmed melee.
- Tweaked the Ai bow range.
- Tweaked the range on Ai spell thunderbolt.
- Reduced the stone throw attack range on Risars.
- Removed the TC deed drops.
- Balanced heavy and sawtooth daggers heads
- Balanced heavy and Triple spear heads.
- Balanced lance heads.
- Balanced great, hand and Kall great axe heads.
- Increased durability on lances.
- Spear heads can no longer be fitted on dagger handles.
- Only lance heads can now be fitted on Lance handles.
- Removed rod slot from fishing UI, because it was meaningless.
- Increased Patrol post HP
- Slightly lowered respawn timer on TC guards.
- Alert Towers now alert for unbuilt siege weapons as well.
- Alert Tower Sentinels are now stationary.
- Increased Metal wall physic damage resist by 25%
- Increased Stone wall physic damage resist by 10%
- Made Myrland terrain a bit darker during night time.
- The Kimuru is now much more vulnerable to magic.
Fixes:
- Trading a pet to a new player will now correctly update the pets flag.
- Fixed issue that made it so that seeds would sometimes not save the correct mount on TS farmers.
- Fixed a placement bug when placing structures. This gave you a error message telling you the structures was intersecting something when it wasn’t.
- Fix for stolen items that got none-stolen when “washed” through a second character.
- Improved magic targeting system.
- Fixed issue where you would always successfully cast spells if you had the minimum required skill.
- Optimized some of the item handling.
- Fixed possible issue in the code that could cause invisible items.
- Fixed spinning issue when you mounted a mount while being bumped by another mounted player.
- You will now correctly get prominence when killing mobs with magic.
- Stolen items now actually shown as stolen in the inventory.
- Stolen items can no longer be placed in banks even in the UI.
- Green Spica icon is no longer too big.
- Alt to selfcast now correctly works with spiritism.
- Fixed icons for Conger Eel and Skull Kua.
- Fixed Ratzar Alate not moving when attacked.
- Fixed an invisible wall inside Huegar cave, now it’s actually visible.
- Fixed Keep NPC’s falling through the floor in Myrland keep basements.
- Fixed so that items don’t go missing until you exit fishing mode when un-equipping line/hook/bait.
- Equipping a bait is no longer required for fishing.
- Equipping a bait that is not in the bait list will now result in a message, and will actually be equipped.
- UI for placing a workbench in a house is now much more reliable and consistent.
- Fixed chat messages of length between 114 and 128 being cut off at the end.
- Skills UI now getting proper XP updates so that bar showing progress to next level works better.
- “Reset UI” works better.
- New pets no longer show as “DEAD” after a pet has been dead.
- Trade broker items sold from a bag inside a bank will no longer go directly to buyer’s bank when bought.
SHROUD OF THE AVATAR SHOWS OFF KOBOLD STYLE
http://massivelyop.com/2016/03/07/shroud-of-the-avatar-shows-off-kobold-style/
http://massivelyop.com/2016/03/07/shroud-of-the-avatar-shows-off-kobold-style/
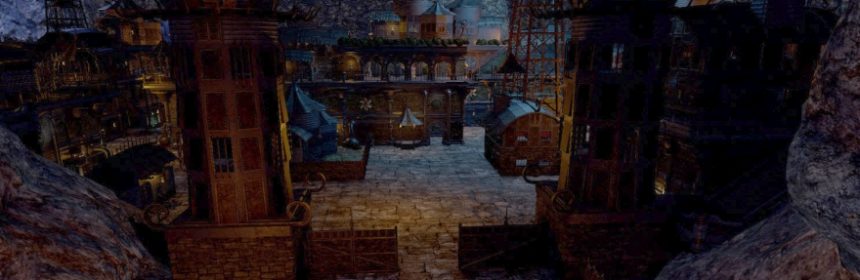
As players venture deeper into the underground of Shroud of the Avatar, they’re going to run into kobolds. That’s just the reality of things. But the kobolds of the game aren’t simply bags of experience to be popped – they have their own style, their own technology, and their own way of building dwellings. The most recent developer dispatch covers the style of kobolds and the look of the race’s settlements.
Kobolds utilize a variety of technology to keep their underground living spaces functional, with hydroponics to grow various fungi underground and mine cart tracks to ship supplies hither and yon. There’s plenty of community news contained within the update as well, but if you just want a slice of the world’s style, you could do worse than getting a good look at how the kobolds lead their lives. Although you might want to turn up your monitor’s gamma a bit first (kobolds do not prioritize lighting, it seems).
Source: Official Site
EVE EVOLVED: ANALYSING EVE’S NEW ECONOMIC REPORTS
http://massivelyop.com/2016/03/06/eve-evolved-analysing-eves-new-economic-reports/
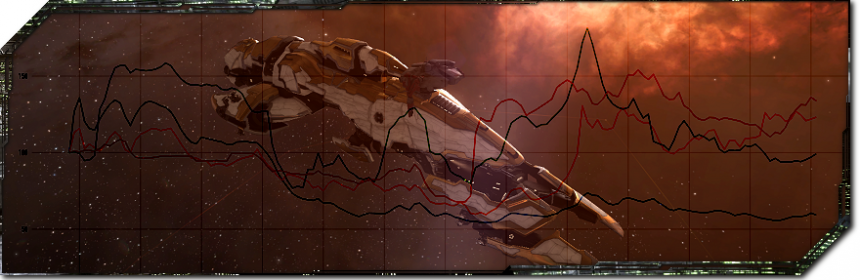
EVE Online‘s massive and largely player-run economy has been a frequent topic of discussion on MMO blogs and gaming news sites over the years. The unregulated nature of EVE‘s sandbox and the fact that all players interact together in a single server has made it the target of high-level studies in free-market economics, and CCP Games even had a full-time economist on staff from 2007 to 2014 to analyse it. Dr Eyjólfur Gudmundsson and his team delivered the in-depth Quarterly Economic Newsletter (QEN) on the state of the game until the reports were cancelled in 2011 due to being time-consuming and costly to produce.
While the majority of EVE players are content to run missions or smash spaceships together for fun and profit, for some it’s the complex markets and industrial gameplay that hold their interest. They fill the Market Discussion forum with speculation and pack the room during the economy talks at events like EVE Fanfest, and they’ve been asking CCP for more economic data since the QENs were cancelled. This week they got their wish as CCP Quant released the first of a new series of monthly economic updates packed full of graphs and statistics from all corners of the EVE universe.
In this edition of EVE Evolved, I look at the new monthly economic reports and glean some useful information from February’s stats. Where is the safest place to mine? What effect did Skill Trading have? And which nullsec alliances are moving their assets?
 The old QENs had some problems
The Quarterly Economic Newsletters were a fascinating source of statistics and insight intoEVE‘s economy, but they often contained faulty assumptions on economic changes. Dr Eyjo knew his field well but frequently attributed market changes to economic events and trends rather than the more obvious effect of game mechanics and other things that don’t happen in the real world. The reports were a great way to promote EVE‘s unique capacity as an economic sandbox to the media, butthe players in EVE‘s Market Discussion forum often provided better insight and analysis.
The QENs hold a special place in EVE‘s history for me as my first ever article for Massively-of-oldwas actually a rebuttal to a news post Dr Eyjo wrote accompanying the Q4 2007 QEN report. In the post, he mistakenly announced that removing the NPC supply of shuttles would cause Tritanium to break the artificial 3.6 ISK per unit cap. Many players were angry when they bought up Tritanium on Dr Eyjo’s advice only to find out that items other than shuttles also maintained the same tritanium price cap. Despite these occasional oversights, the reports were a fantastic look into changes in the EVE economy over time and the impact of new ships or expansions. They’ve caused more than a few players to become interested in economics and even go on to study it.
 New economic reports (yay graphs!)
The QENs were supposed to come back in a new annual format further down the line, but that never materialised and Dr Eyjo eventually left CCP in 2014. Rather than trying to replicate the professional style of the old QENs, the new reports simply provide regular snapshots of the EVE economy without any written analysis or speculation on what may have caused particular changes or trends.
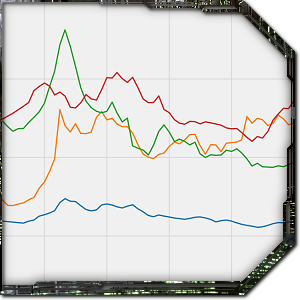
At the end of each month, CCP Quant runs a series of carefully crafted SQL queries on the main EVEdatabase to extract a ton of economic information from across the game. He then compiles it into graphs (because we EVE players seriously love our graphs) and releases them alongside a full CSV exports of the data so that players can perform their own analyses. As the new economic reports are released on a monthly basis and we’ll be getting the same types of data each time, we can more easily compare data from month to month and find interesting trends. The written analysis and speculation is now entirely up to players. February’s graphs and charts are included below for your convenience:


 Where does all the ISK come from?
Taking a flip through the graphs provided this month, I’m most interested in the list of ISK sinks and ISK faucets. The top three generators of new ISK in the EVE economy for February were predictably NPC bounties (33.876 trillion ISK), sales of commodities to NPC corporations (18.172 trillion ISK), and Incursion payouts (11.245 trillion ISK). The commodities sales include sleeper AI loot and valuable tags from NPC loot, so all of these top three are the direct result of players farming NPCs. Agent mission rewards also accounted for about another 2.4 trillion ISK.
The main way ISK is removed from the game this month was the purchase of skills from NPC corps on the market, with 13.602 trillion ISK sunk into skill books over the period. This would normally hint that EVE still has a large number of newer players and those who are still actively training toward new areas of gameplay, but there’s a simpler reason this was so high in February. The introduction of Skill Injectors meant players could buy new skills and train them instantly, so it’s understandable that there would be a spike in skill purchases. The ISK Velocity chart also shows a huge spike in Februrary due entirely to players trading in skill injectors. At the end of February 2016, the total liquid ISK in the EVE Online economy was 948.043 trillion ISK (equivalent to $16.45 million using PLEX conversion).
 Trade hubs and the safest place to mine
Another useful graph in the report was the Regional Data for February 2016 chart, which shows the net value of various types of economic activity depending on region. The Forge contains more trade than all other regions put together with 707.5 trillion ISK in transactions, which was expected as this region contains the game’s central trade hub in Jita. The Forge is also the region with the highest production and import levels, which isn’t surprising as everyone ships their stuff to Jita for sale and people try to build as close to the system as possible in order to shorten hauling trips and source cheap materials nearby.
Domain comes second in raw trade volume at 114.1 trillion ISK thanks to the major trade hub in the Amarr system, with Sinq Liason and Heimatar coming in third and fourth place. It’s interesting to see that EVE‘s trade is still incredibly centralised, and that Dodixie in Sinq Liason has grown in market share in recent years. It’s also interesting to see that there’s a lot of mining going on in The Forge and that high mining value also seems to be correlated with high ship destruction value. The safest popular mining location would seem to be Everyshore, which pumped out 800 billion ISK in ore during February and has an active market but has only 100 billion ISK of ship destruction. This could also indicate the presence of a huge mining operation here, possibly one using bots.
 What are nullsec alliances getting up to?

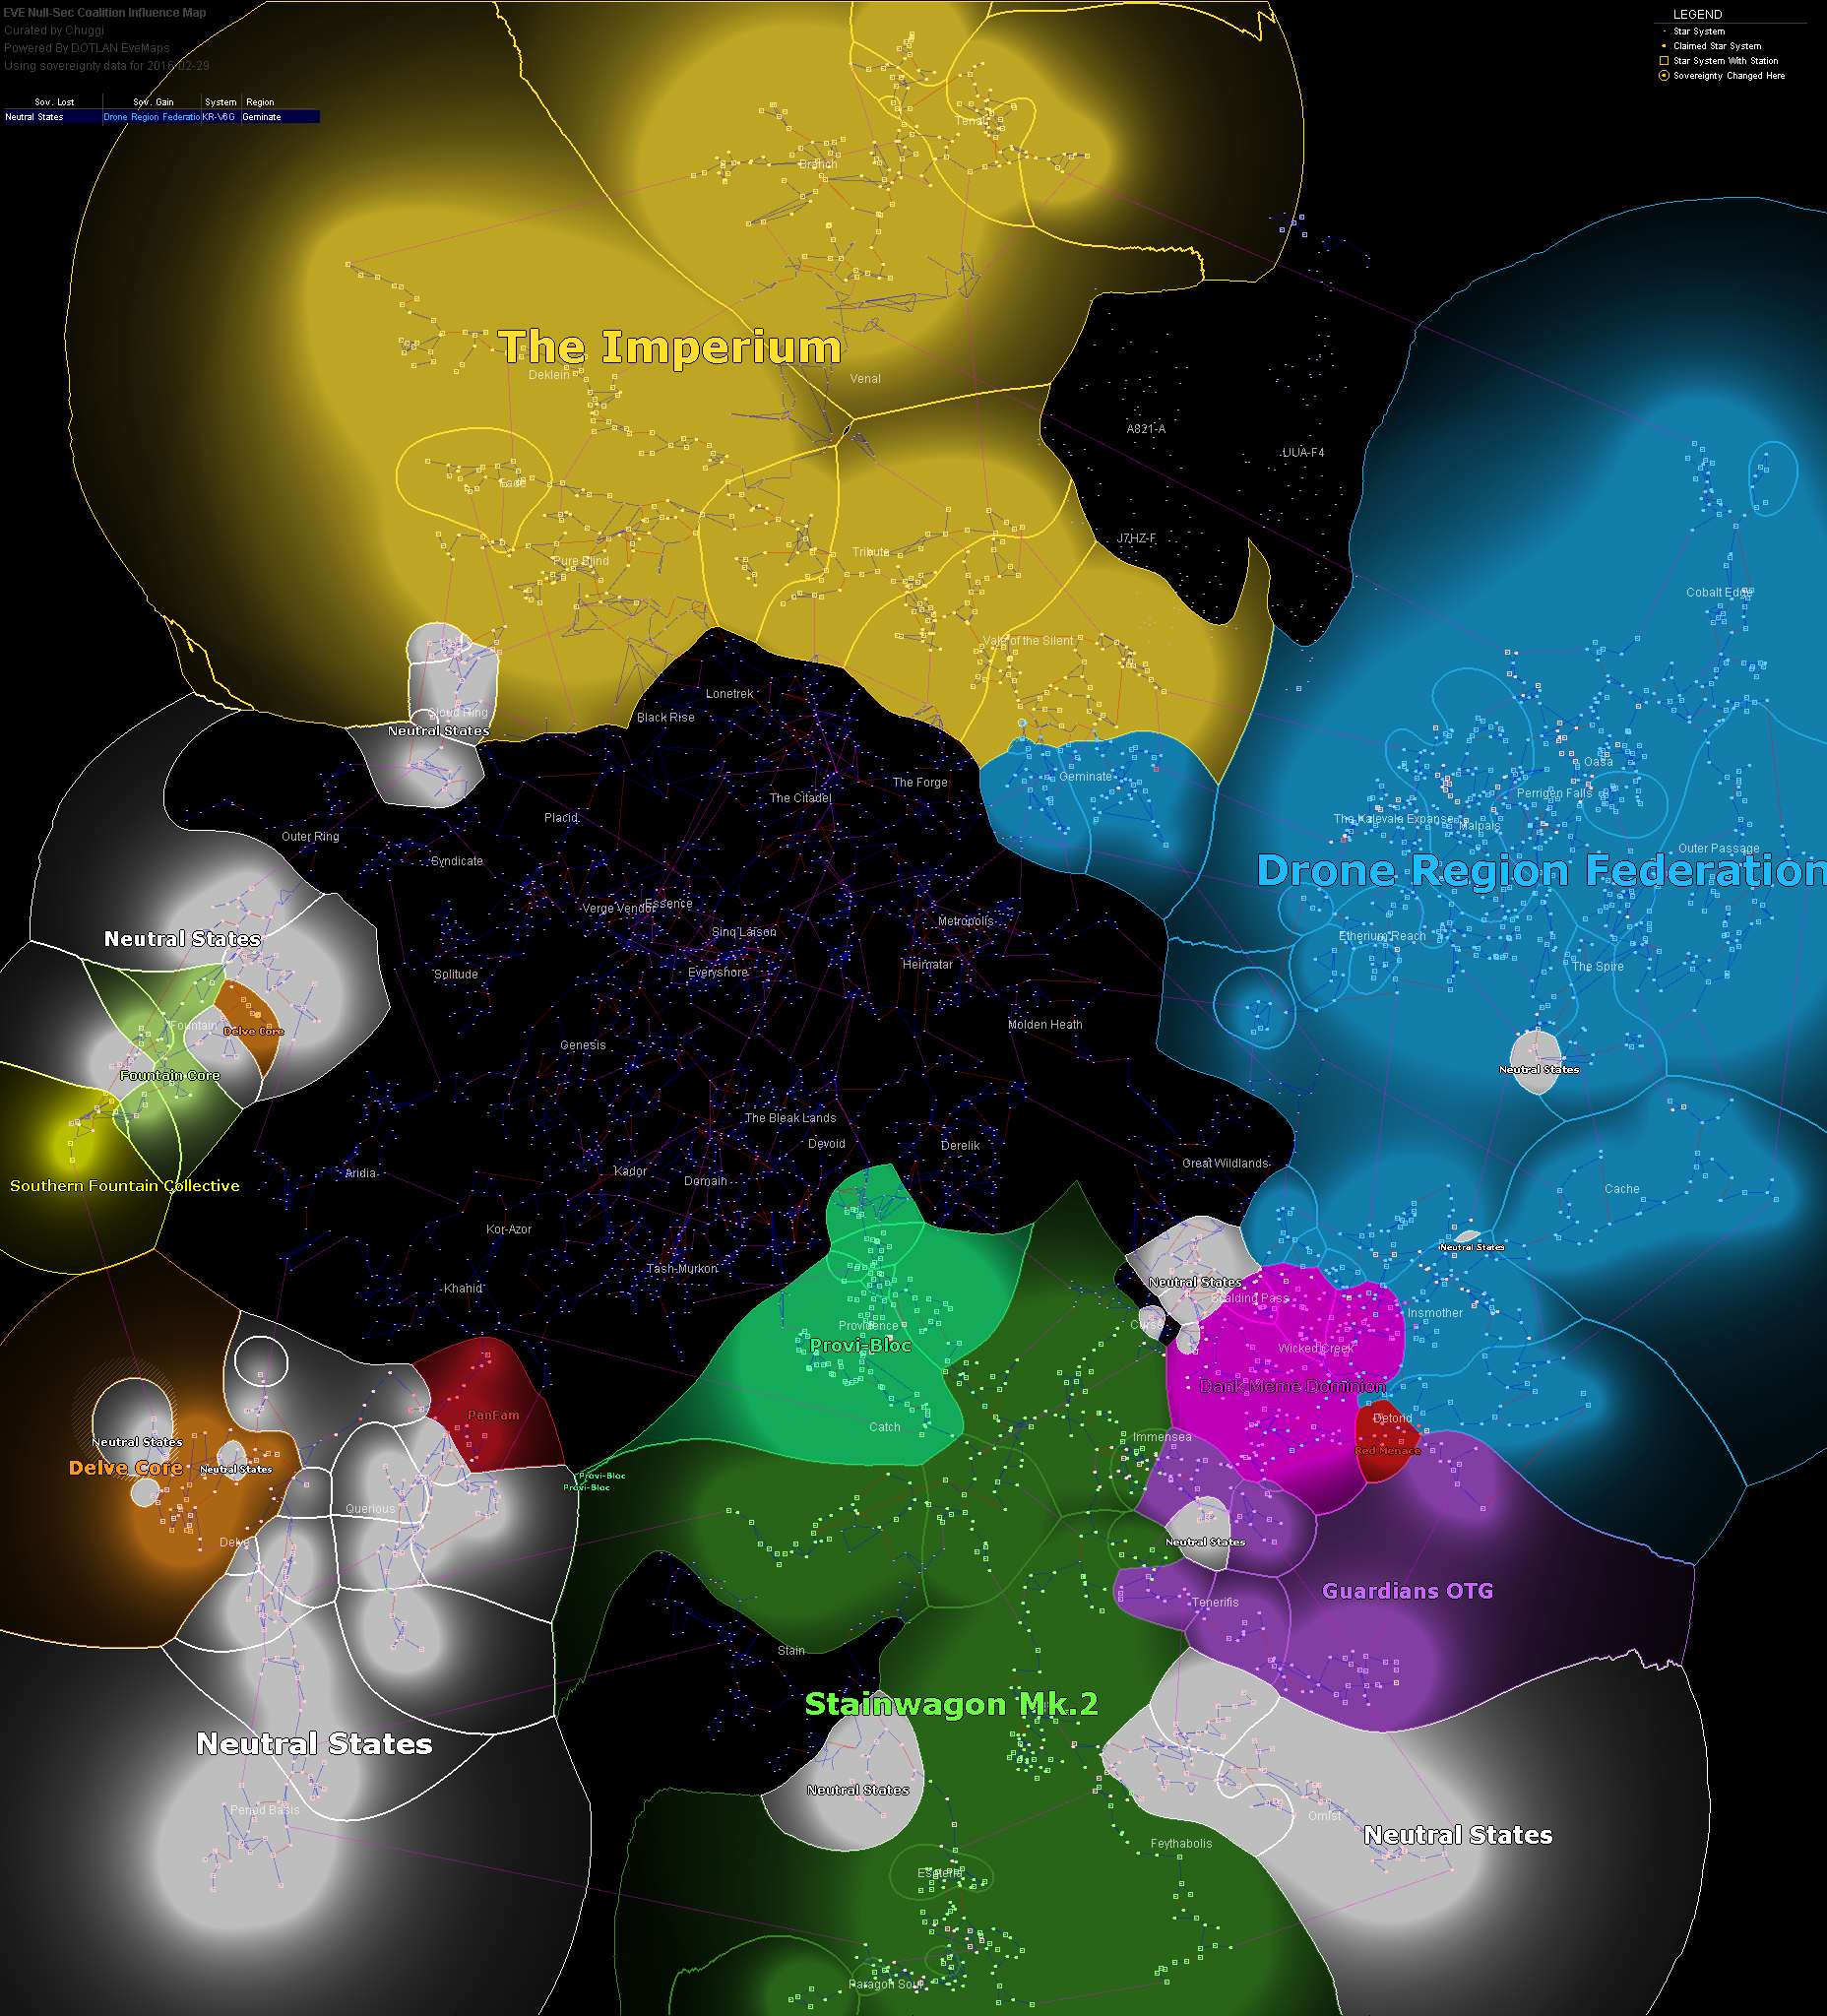
The chart of Net Exports by Region shows that Jita imports around 20 trillion worth of goods each month, but the next-highest importing regions are Tenerifis (16.8 trillion ISK), Delve (16.0 trillion ISK), Providence (11.72 trillion ISK), Pure Blind (10.56 trillion ISK), and Catch (8.82 trillion ISK). These are highly populated areas owned by nullsec alliances that are reliant on shipping in goods from empire. The high imports in these regions may indicate the creation of military stockpiles or the replacement of capital ships lost in recent wars.
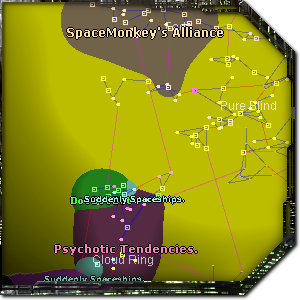
Interestingly, some nullsec regions were reported as heavy exporters throughout February, with Period Basis exporting 8.67 trillion ISK worth of goods and Fade exporting 7.84 trillion ISK. As mining and production in those regions were both very low, this means the people living there must have moved a lot of their valuable assets out of the region. Both SpaceMonkey’s Alliance in Fade and RUCA Emperor in Period Basis lost members and territory during the month, so this isn’t altogether surprising.
The export figures for the regions may indicate that members of those alliances have no confidence in their ability to hold their territory and were evacuating assets. They could also be simply moving their staging systems for fleets somewhere else or may have taken considerable ship losses. It’ll take someone with more in-depth knowledge of current nullsec events and politics than I to figure out exactly what’s going on here, but it’s pretty exciting to have access to these kinds of broad data to speculate with. I’m looking forward to seeing what the EVE blogging community makes of this economic report and what new information might be included in next month’s installment.
 EVE Online expert Brendan ‘Nyphur’ Drain has been playing EVE for over a decade and writing the regular EVE Evolved column since 2008. The column covers everything from in-depth EVE guides and news breakdowns to game design discussions and opinion pieces. If there’s a topic you’d love to see covered, drop him a comment or send mail tobrendan@massivelyop.com!
Black Desert Online – Housing and Crafting
Mortal Online: Magic Development Update 7
http://www.mortalonline.com/magic-development-update-7/

Magic Development Update 7
Progress update
It’s real close!
We have started feeding the testers with “final patches” now. These are the patches that you use when you patch unless something goes horribly wrong during QA.
It’s been quite a long development cycle for this patch but it does contain a whole lot of new content for you to dive into.
Not only brand new spells, but also new uses for old items, more skills, and a ton more content in the Etherworld.
We have updated the “Manual” section of the webpage with a short section explaning the basics of the new Etherworld, you can read it here.
If everything goes as planned the patch should be ready for download this monday, the 7th of March. Note that this could change depending on how the QA-session over the weekend turns out.
We have however posted the pre-patch notes and they can be found right here.
The lore for the Etherworld and spiritism has also been released and can be found here.
Priest Beacon
Priest beacons have changed in style with the patch.
They are now bright red and easier to spot in the distance (since red is one of the only colors you can see in the Etherworld). The engine no longer shows ALL beacons instead it shows the closest beacons.
We believe this will sort the issue some players had with FPS drops in the etherworld and would love to get feedback from those players once the patch hits.


New spell effects
Alright, time to show of one more new spell effects just before you get a chance to try them out on your own.
Mental Projectile
This spell deals direct damage to its target if cast from the world of the living and Kau damage if cast from the Etherworld.
